Climate deniers sow weather-map heatwave misinfo / Photo: Kenan AUGEARD - AFP
Climate-change deniers on social media have a viral way of spreading scepticism during a heatwave: by publishing weather maps out of context to imply forecasters are exaggerating climate change.
During the two recent heatwaves in Europe, users in various countries and languages misleadingly juxtaposed weather maps, sometimes taken from different media organisations at non-comparable dates.
Such posts typically include messages suggesting that the colour of the maps has been changed to red by media or authorities seeking to create panic.
AFP Fact Check has debunked several versions of the claim, which have surfaced in languages including English, German, Spanish, French, Hungarian and Polish.
"Back when there was no need to make people afraid of global warming, they put suns" on weather maps, said one post shared in Spanish and Catalan during this week's heatwave. "Now they have to colour the map as if we were in hell itself."
The two side-by-side maps under the post showed hot weather over Spain. One was white with sun symbols, the other dark red. A digital investigation by AFP revealed they were two different types of map from different sources - not, as the post claimed, from a single forecaster that had manipulated its colour scheme.
- Coloured red? -
In English and German, numerous similar claims circulated during last month's heatwave.
"In 1986 it was called a normal summer. Today they colour the map red and call it extreme heat," said a Facebook post published on May 25, 2022.
The two side-by-side maps showed similar temperatures over Sweden. One was green and dated 1986, the other orange and dated 2022.
A digital investigation revealed that the years on the maps were incorrect and they were from different news organisations that use different colour codes.
Thousands of social media users shared the same image in French, claiming it was evidence of a "global warming scam." The claim was also widely shared on Twitter.
Posts in Germany in June showed two maps from the news show Tagesschau, claiming it had changed their colour from green in 2009 to red in 2019 to hype the climate threat. AFP published a detailed debunk of the claim.
Tagesschau explained that the red map was a temperature forecast, and even in 2009 such maps had used red. The green one was a general weather forecast with different colour scheme and variables.
A similar montage went viral in French. As an AFP investigation showed, it misleadingly juxtaposed maps from different media organisations at different times of year.
Previously in Spain, users shared a photo of a newspaper from 1957 that reported a temperature record of 50 degrees Celsius. The article was authentic but Spanish meteorologists said that temperature measurement was not certified or recorded in official data.
- Climate change is real -
Climate scientists overwhelmingly agree that carbon emissions from humans burning fossil fuels are heating the planet, raising the risk and severity of heatwaves and other extreme weather events.
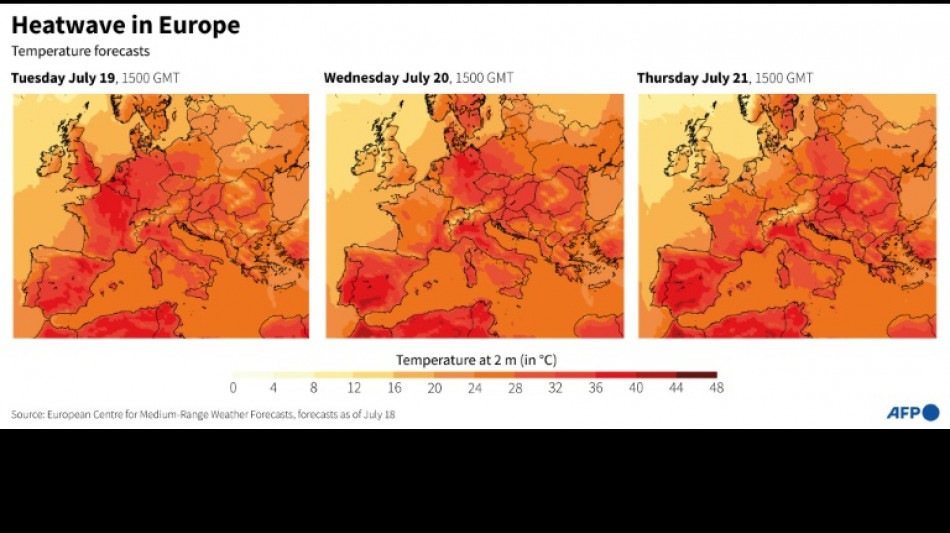
With temperatures topping 40 C, the heatwave in Britain this week prompted comparisons with the summer of 1976, when the temperature peaked at 35.9 C.
Experts said the comparison was unhelpful.
"Of course there have been heatwaves in the past, but the big difference with 1976 is what the rest of the world looked like," said said Friederike Otto, senior lecturer at Imperial College London's Grantham Institute for Climate Change.
"In '76 there was a heatwave in (Britain), in 2022 there are heatwaves everywhere in the world and so there have been in 2021, '20, '19," she told reporters on Monday.
Nostalgia for 1976 - sometimes accompanied by misleading map-sharing - irritated some users on social media.
"Folk keep sharing the fake f**king image showing 'WEATHER in my day' bla bla bla," wrote one user, identified as Talent Stockport, on July 17.
"Its misleading" (sic), the post continued. "Your spreading miss information which could actually put peoples lives in danger, and its the same type of people too. The people who are unable to process basic facts."
The AFP fact check articles cited in this story can be found with full explanations of the methods used, in different languages at factcheck.afp.com.
W.O.Ludwig--NZN