US communities are mapping heat islands to boost climate resilience
/ Photo: Bastien INZAURRALDE - AFP
The phone's home screen shows 90 degrees Fahrenheit (32C) in Silver Spring, a suburb of Washington, on a mid-August day. But the reality is more complex -- in terms of heat exposure, not all parts of the city are equal.
Maria Velez, 53, knows she is lucky to live next to a creek. A stone's throw from her house, other neighborhoods with small apartment buildings are far more built-up and much less green.
That is the perfect recipe for creating heat islands, recording much higher temperatures sometimes across just a few streets.
The phenomenon is becoming more and more dangerous because of the global climate crisis.
In the United States –- where hurricanes, tornadoes and floods are a fact of life –- the meteorological phenomenon that kills the most is none other than heat.
This is why Velez, a resident concerned about the subject, chose to participate in a campaign aimed at mapping these heat islands in Montgomery County, where she lives, just to the north of the American capital.
The initiative is headed by the National Oceanic and Atmospheric Administration (NOAA), which for six years has made it possible to study some 70 counties across the country, with the help of residents.
"I signed up right away," Velez, a criminology professor, told AFP. "I thought this is exactly what the county should be doing. We should be learning about what's going on with climate change, and what the impacts are."
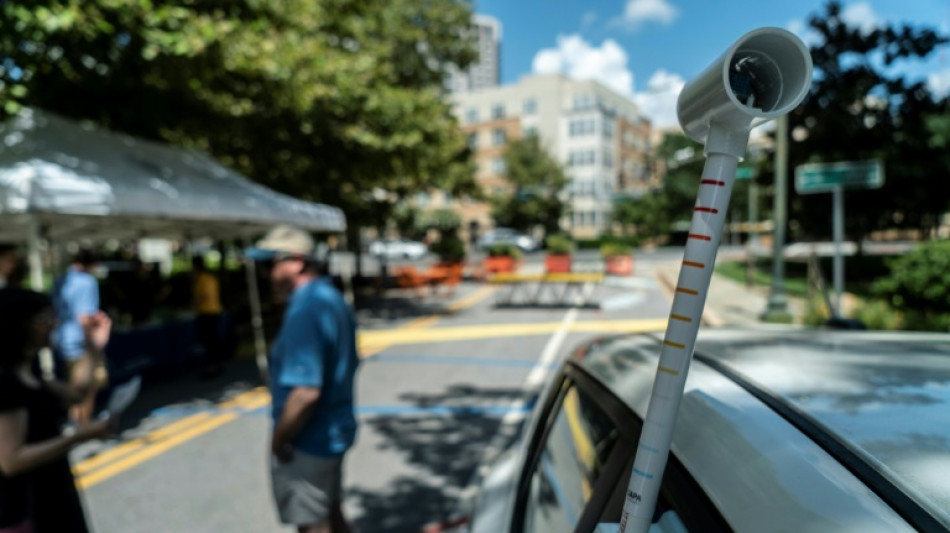
She and her husband hang a sensor, which looks like a can on the end of a rod, out the passenger side of their gray family car. Once turned on, the device records the temperature, humidity, time and its exact position every second.
The couple was assigned a route of about 10.6 miles (17 km), to be covered at no more than 35 miles per hour (55kph), covering a large part of the city.
Within an hour, they return to their starting point, where county employees await them, retrieving the sensor and noting any difficulties encountered -- in their case, a failed roundabout exit that led them to make the turn twice.
T-shirts with the words "Street Scientist" are handed out to thank the volunteers.
- Historic inequalities -
In total, more than a hundred people took part in the experiment that day: 57 teams of two traveled 19 different routes, covering around 200 square miles.
Temperature was measured along each route three times during the day: at 6:00 am, 3:00 pm, and 7:00 pm.
The program was a success that surprised even its organizers: nearly 600 residents had registered to participate, meaning 500 had to be refused.
Those chosen were offered a few tens of dollars for their time, but more than 60 percent did not take the money.
The sensors were then sent to the partner company, CAPA Strategies, which in a few weeks will analyze the data and transform it into detailed maps, indicating the hottest spots.
"It's going to tend to be low income communities and communities of color that are most impacted by this," Gretchen Goldman, a climate scientist with White House Office of Science and Technology Policy, who was present for the occasion, told AFP.
An important study on Richmond, Virginia, showed the impact that old discriminatory policies still have.
"Redlining," which saw banks limit housing loans to residents of certain poor, Black neighborhoods marked with a red line on maps, reinforced segregation -- with hotter communities today as a result.
"We were able to see the impact of that discriminatory policy even decades and decades later," said Goldman.
- Transforming cities -
Adapting to increasingly extreme heat episodes, fueled by climate change, is becoming essential.
Today, the number of days above 90F in Montgomery County is about 19 per year. In 2050, it will be 70 days, according to Ken Graham, director of the National Weather Center, which is part of NOAA.
Urban heat islands form because the sun's heat is absorbed more by impervious surfaces such as concrete, roads, buildings, than by grass or water, for example.
Planting trees is therefore essential, but other solutions are also being developed, such as ultra-reflective paints.
Thanks to the mapping campaigns carried out in recent years, "there's been parks that have been built in some of these communities, there's been changes in roofing, a dark roof versus a light roof," said Graham.
That's just a taste of the future we need to prepare for, he said. "It's going to take all of us to be a climate ready nation. And if we work together, we can do it."
A.Wyss--NZN